Introduction
Businesses today generate information from almost every activity, including sales, finance, customer interactions, marketing campaigns and daily operations. However, having access to large amounts of data does not automatically lead to better business decisions.
The real challenge is bringing information together, understanding what it means and turning it into insights that support business growth.
For organisations operating in Singapore's competitive business environment, having a clear view of business performance is increasingly important. Companies need reliable reporting systems, connected data sources and analytical tools that help management teams understand what is happening across their operations.
This is where Business Intelligence (BI) and Analytics Solutions become valuable.
BI and analytics solutions help businesses collect, integrate, analyse and visualise information from different sources. They make it easier for organisations to monitor performance, identify business trends and make informed operational and strategic decisions.
At SGR Software Solutions, our BI and Analysis Services focus on helping businesses develop customised dashboards, integrate multiple data sources, automate executive reporting and improve access to business information.
In this article, we explore why Singapore businesses are investing in BI and analytics capabilities, how these solutions support different departments and what organisations should consider when choosing a BI and analysis company.
1. What Are Business Intelligence and Analytics Solutions?
Business Intelligence refers to the technologies, processes and systems used to collect, organise, analyse and present business information.
Analytics goes further by helping organisations examine data, understand patterns, identify trends and evaluate possible business outcomes.
Together, BI and analytics solutions provide a structured way to convert information from different business systems into meaningful insights.
For example, a company may maintain its sales records in one system, financial information in another and customer data in a CRM platform.
Without an integrated reporting environment, management may need to review multiple reports to understand overall performance.
A properly designed BI solution can bring relevant information together through interactive dashboards and centralised reporting.
Common capabilities include:
- Data Integration: Connecting information from databases, Excel, ERP, CRM and cloud platforms.
- Dashboard Development: Building interactive dashboards for business monitoring and performance analysis.
- Data Modelling: Structuring information for consistent reporting and analysis.
- Reporting Automation: Reducing repetitive manual reporting activities.
- Business Analytics: Identifying trends, performance gaps and opportunities through data analysis.
These capabilities help organisations make better use of their existing business information.
2. Why Singapore Businesses Need BI and Analytics Services
Singapore is home to businesses operating across financial services, healthcare, retail, manufacturing, logistics, technology and other industries.
As organisations expand their operations, the amount of information they generate also increases.
Managing this information through disconnected spreadsheets and manual reports can become difficult.
Here are some reasons businesses consider investing in professional BI and analytics services.
A. Better Business Performance Monitoring
Management teams need regular visibility into revenue, expenses, productivity, sales and operational performance.
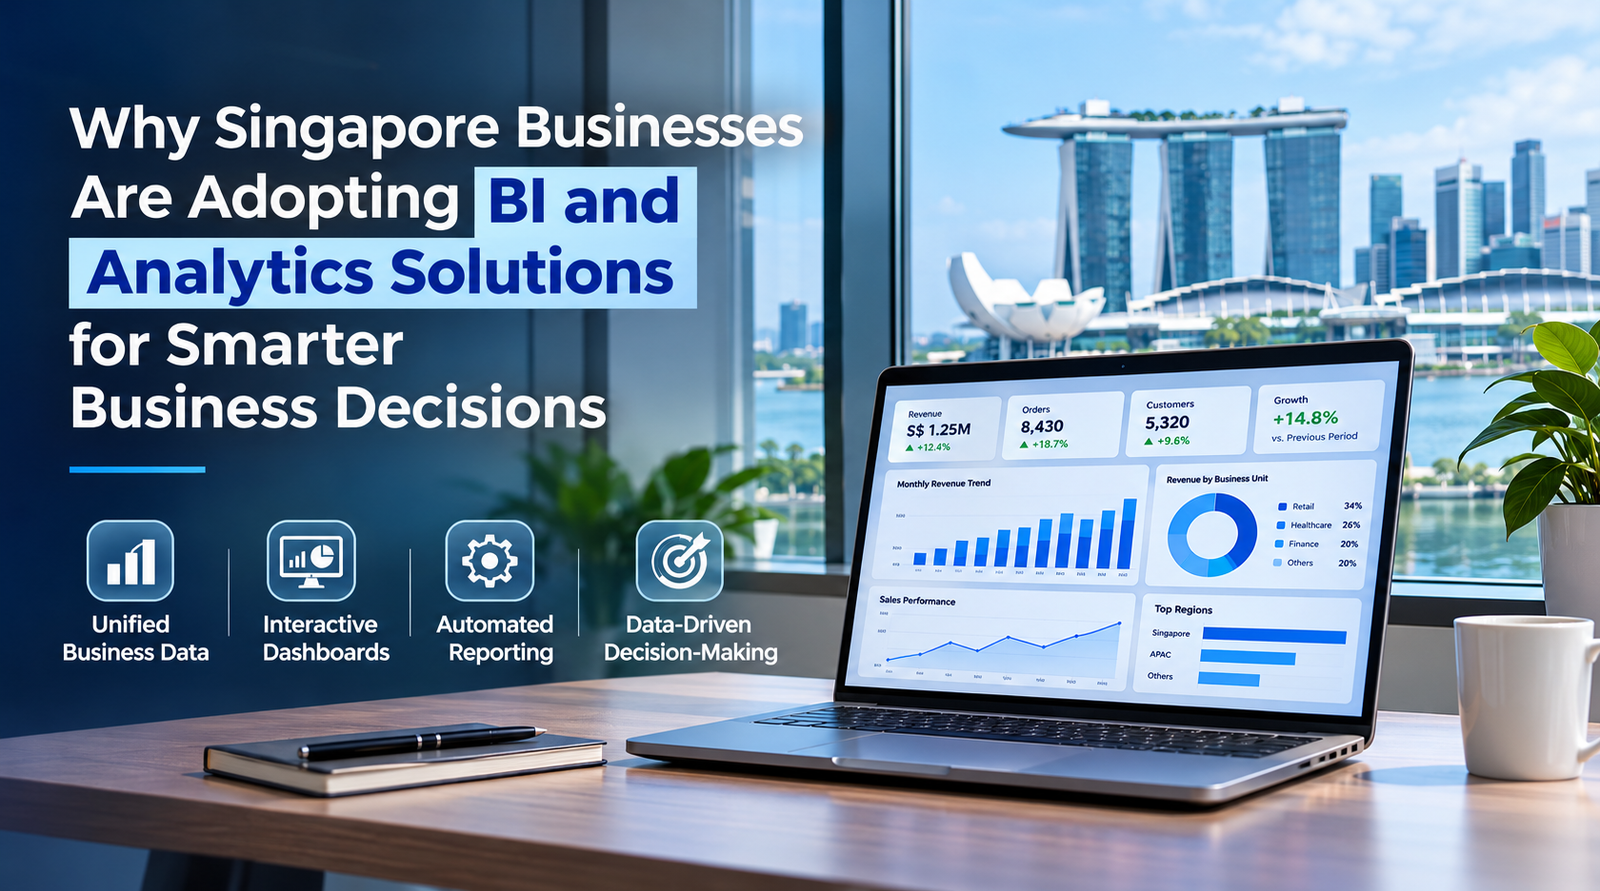
BI dashboards help bring important performance indicators together in a single reporting environment.
For example, an executive dashboard can display:
- Monthly revenue and profitability.
- Department-wise performance.
- Sales growth and conversion rates.
- Operating expenses.
- Customer acquisition trends.
- Business target achievements.
Instead of reviewing multiple spreadsheets, decision-makers can access relevant business metrics through interactive reports.
B. Less Dependence on Manual Reporting
Manual reporting often involves collecting information from different departments, updating spreadsheets and preparing reports repeatedly.
This process can become time-consuming, particularly for organisations managing multiple business functions.
BI reporting automation helps streamline recurring reporting activities through connected data sources and scheduled refreshes.
For example, a finance team can use an automated dashboard to review monthly expenditure, revenue and budget performance without repeatedly preparing the same reports manually.
C. Better Data Visibility Across Departments
Different departments often use different software systems and maintain separate databases.
This can make it difficult for management to obtain a consolidated view of organisational performance.
BI and data integration services help connect relevant information from multiple systems.
For example:
- Sales teams can monitor customer enquiries and conversions.
- Finance teams can analyse revenue and expenditure.
- Marketing teams can evaluate campaign performance.
- Operations teams can monitor productivity and delivery performance.
A connected reporting environment helps departments work with consistent information.
D. More Informed Business Decisions
Business decisions involving expansion, budgeting, resource allocation and customer acquisition require reliable information.
BI and analytics solutions help decision-makers compare historical performance, monitor current results and identify patterns that need attention.
For example, an organisation can analyse declining sales in a particular product category or identify operational expenses that are increasing over time.
These insights provide a stronger basis for business planning.
E. Support for Enterprise Growth
As businesses grow, their reporting requirements become more complex.
An organisation operating across multiple locations, departments or business units may need consolidated dashboards and standardised reporting structures.
Enterprise BI solutions can help manage these requirements through customised data models, integrated data sources and role-specific dashboards.
3. Key Applications of BI and Analytics Across Business Industries
BI and analytics are not limited to one industry. Their applications depend on the type of information an organisation collects and the decisions it needs to make.
A. Financial Services and FinTech
Financial organisations work with large volumes of transactional, customer and operational information.
BI solutions can help finance teams and management monitor:
- Revenue and profitability.
- Financial performance indicators.
- Budget utilisation.
- Transaction trends.
- Operational risk indicators.
- Customer activity patterns.
Customised financial dashboards can provide management with a consolidated view of relevant business metrics.
B. Healthcare and Medical Organisations
Healthcare organisations need visibility into appointments, service utilisation, operational activities and resource management.
BI dashboards can support analysis of:
- Appointment and patient service trends.
- Department-wise operational performance.
- Resource utilisation.
- Administrative costs.
- Service demand.
Healthcare data must be handled with appropriate privacy, security and access controls.
C. Retail and E-commerce
Retail businesses generate information through sales transactions, customer activity, inventory systems and online platforms.
BI analytics can help retailers understand:
- Product-wise sales performance.
- Inventory movement.
- Customer buying patterns.
- Store-wise revenue.
- Seasonal demand.
- Marketing campaign performance.
This information can support inventory planning and business performance monitoring.
D. Manufacturing and Supply Chain
Manufacturing and logistics businesses need to monitor production, inventory, transportation and operational performance.
BI solutions can help management analyse:
- Production output.
- Inventory availability.
- Delivery performance.
- Warehouse operations.
- Supplier performance.
- Operational costs.
Integrated dashboards can provide better visibility into different stages of business operations.
E. IT and Professional Services
Technology and professional services companies often manage multiple projects, teams, clients and service agreements.
BI dashboards can help track:
- Project progress.
- Resource utilisation.
- Revenue by project.
- Employee productivity.
- Client acquisition.
- Service delivery performance.
This can help management review project performance and identify areas requiring attention.
4. How BI Dashboards Help Management Teams
One of the most useful applications of BI and analytics is the development of customised executive dashboards.
An executive dashboard brings important business indicators together so management can review performance without examining multiple individual reports.
For example, an enterprise dashboard may include:
Sales Dashboard
- Monthly and quarterly revenue.
- Salesperson performance.
- Lead conversion.
- Product-wise revenue.
Financial Dashboard
- Revenue and expenses.
- Profitability.
- Budget versus actual performance.
- Cash flow indicators.
Operations Dashboard
- Project status.
- Department performance.
- Resource utilisation.
- Operational efficiency.
Marketing Dashboard
- Campaign performance.
- Lead generation.
- Customer acquisition cost.
- Conversion rates.
The dashboard structure should be based on the organisation's reporting requirements rather than using the same design for every business.
5. The Role of Power BI in Enterprise Business Intelligence
Power BI is one of the technologies businesses can use to develop interactive dashboards and analytical reports.
As part of a broader BI and analytics environment, it can support data integration, visualisation, data modelling and business reporting.
At SGR Software Solutions, Power BI-related capabilities include:
- Interactive executive dashboards.
- DAX scorecards and analytical calculations.
- SQL and multi-source cloud data integration.
- Automated executive reporting.
- Mobile-friendly BI dashboards.
- Power BI Embedded and integration requirements, where applicable.
Power BI can connect with different business data sources, including SQL databases, Excel, SAP ERP, Salesforce and supported cloud data platforms.
The right implementation depends on the organisation's existing systems, reporting requirements, data architecture and user requirements.
For businesses in Singapore looking for Power BI enterprise analytics, a customised approach can help ensure that dashboards support actual operational and management needs.
6. Why Custom BI Solutions Are Important for Enterprises
Every business has different reporting requirements.
A retail company may need detailed inventory dashboards, while a financial organisation may prioritise profitability, revenue and transaction reporting.
Using generic dashboards without considering business requirements may not provide the information management teams actually need.
Custom BI and analysis services help organisations develop reporting environments around their specific objectives.
Some important considerations include:
A. Business-Specific Reporting Requirements
Identify the metrics management wants to monitor and the decisions those metrics should support.
B. Integration With Existing Systems
Determine which databases, applications and business platforms need to be connected.
C. Data Modelling and Calculations
Create suitable data models and business calculations to ensure consistent reporting.
D. Dashboard Design
Organise information into meaningful visualisations that are easy for different users to understand.
E. Security and User Access
Establish appropriate permissions, data access policies and reporting controls.
A well-planned BI implementation should address both technical requirements and business objectives.
How SGR Software Solutions Supports BI and Analysis Requirements
Businesses need more than visual reports. They need a BI environment that connects information, supports regular reporting and provides useful insights for management.
SGR Software Solutions offers BI and Analysis Services designed to help organisations develop customised business intelligence and reporting solutions.
Our capabilities include:
Interactive Executive Power BI Dashboards
Development of interactive executive dashboards and DAX scorecards to help management monitor relevant business performance indicators.
Live SQL and Multi-Source Cloud Data Integration
Integration of business information from SQL databases, SAP ERP, Salesforce, Excel and supported cloud data sources.
Automated Executive Reports and Mobile BI
Development of automated KPI reporting workflows and dashboards optimised for smartphones and tablets.
Enterprise-Focused Development Approach
SGR's service offering also highlights:
- Full IP and code ownership.
- Agile development sprints.
- Mutual NDA and confidentiality practices.
- Ongoing technical support.
- Customised development according to business requirements.
Whether your organisation needs executive reporting, multi-source data integration or customised Power BI dashboards, SGR can help assess the requirements and discuss a suitable BI implementation approach.
Looking for BI and Analysis Services in Singapore?
Connect with SGR Software Solutions to discuss your business intelligence, dashboard development and enterprise analytics requirements.
Explore our services:
https://www.sgrsoftwaresolution.com/service?slug=bi-and-analysis
Contact the SGR team to discuss your project requirements and request a technical consultation.
Conclusion
As business operations become increasingly data-driven, organisations need reliable ways to connect information, monitor performance and understand their business activities.
BI and analytics solutions provide businesses with the capabilities to bring data together, automate reporting and create dashboards that support informed decision-making.
For Singapore organisations, investing in the right business intelligence infrastructure can help improve reporting visibility across departments and support future business growth.
Choosing an experienced BI and analysis development partner is equally important. The right technical approach, data integration strategy and customised dashboard design can make business information more accessible and useful.
SGR Software Solutions helps businesses explore customised BI and Analysis Services, Power BI dashboard development, data integration and enterprise reporting solutions.
Visit SGR Software Solutions to discuss your business intelligence requirements.